How Do I Add Tags with the Data Bin
This article will show you how to use the Data Bin to drag and drop fields individually or an entire table into your template. For more specific information on the Data Bin tool, see the Data Bin Reference.
Dragging and Dropping Fields from the Data Bin
After connecting to your data source(s) the Data Bin will appear automatically in a right-side pane. You can also access the Data Bin in the Windward tab of your MS Ribbon.
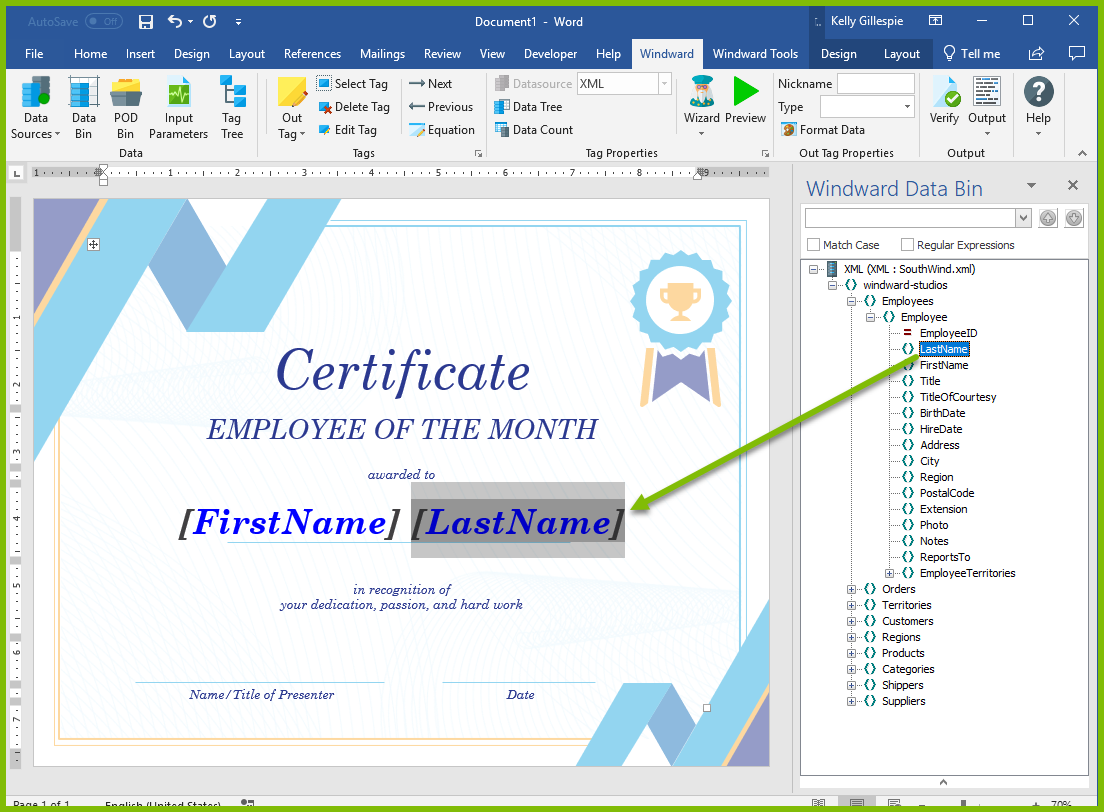
If you data source contains a single instance of data NOT an array. Then you can easily drag and drop fields right from the Data Bin into your template.
Dragging and Dropping Tables from the Data Bin
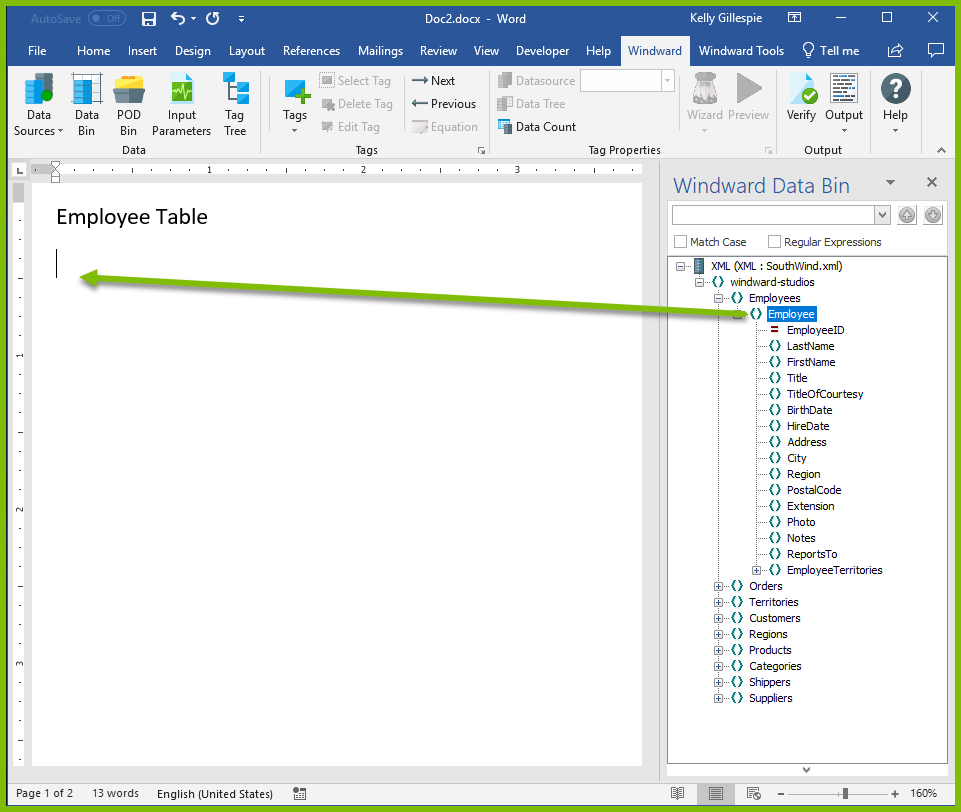
Nodes and sub-nodes of data are organized neatly for easy retrieval. The Data Bin was designed for simplicity, so to create a table of data using the Data Bin, simply select a category (for instance Employees) and drag it on to your Template.
Selecting the Columns for your Table
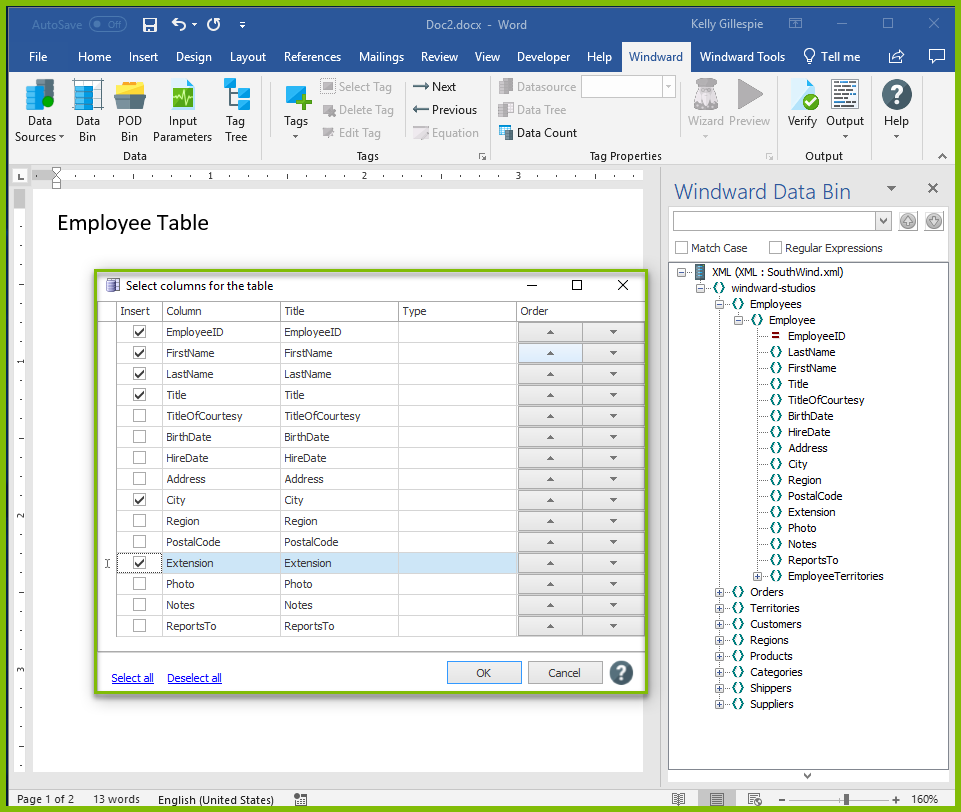
The "Select columns for the table" window will appear (shown below). Select the data you wish to see in your table. In the image below, if you kept all the boxes selected, you would end up with a table that had 18 columns! While this might be what you want, it's most likely that you only need to select some of the data nodes for your table.
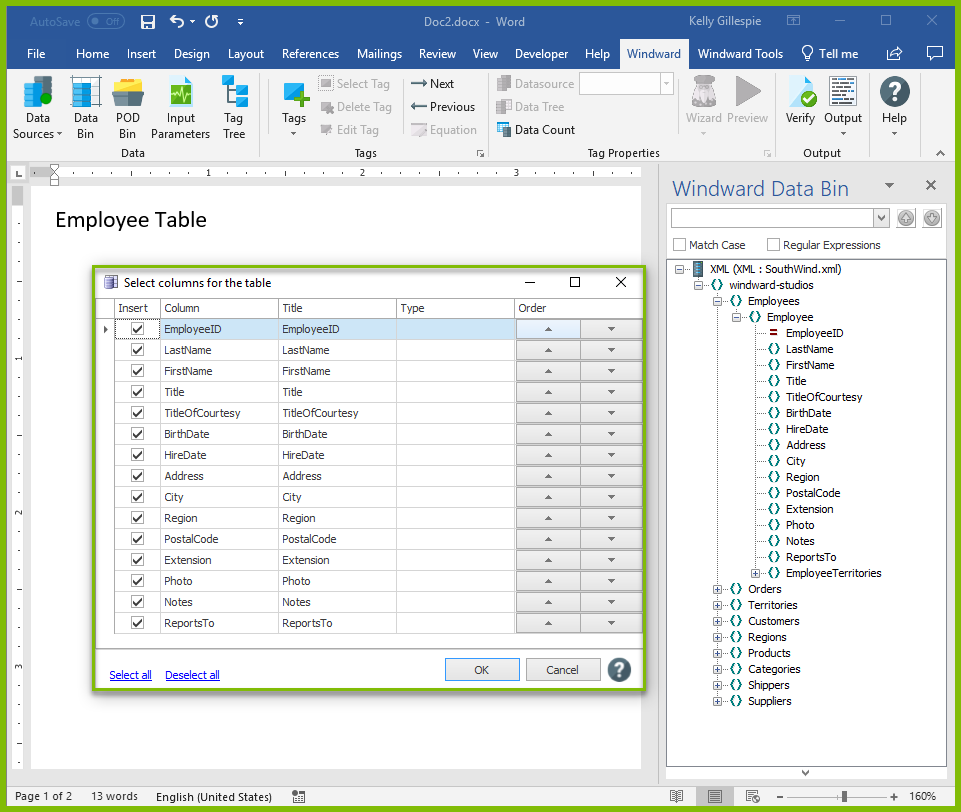
- You can click the "Deselect All" button to unselect all data and just choose the items you need in your report
- Use the up and down arrows to change the order of the items you have selected
- Once you have made your data selections, hit OK.
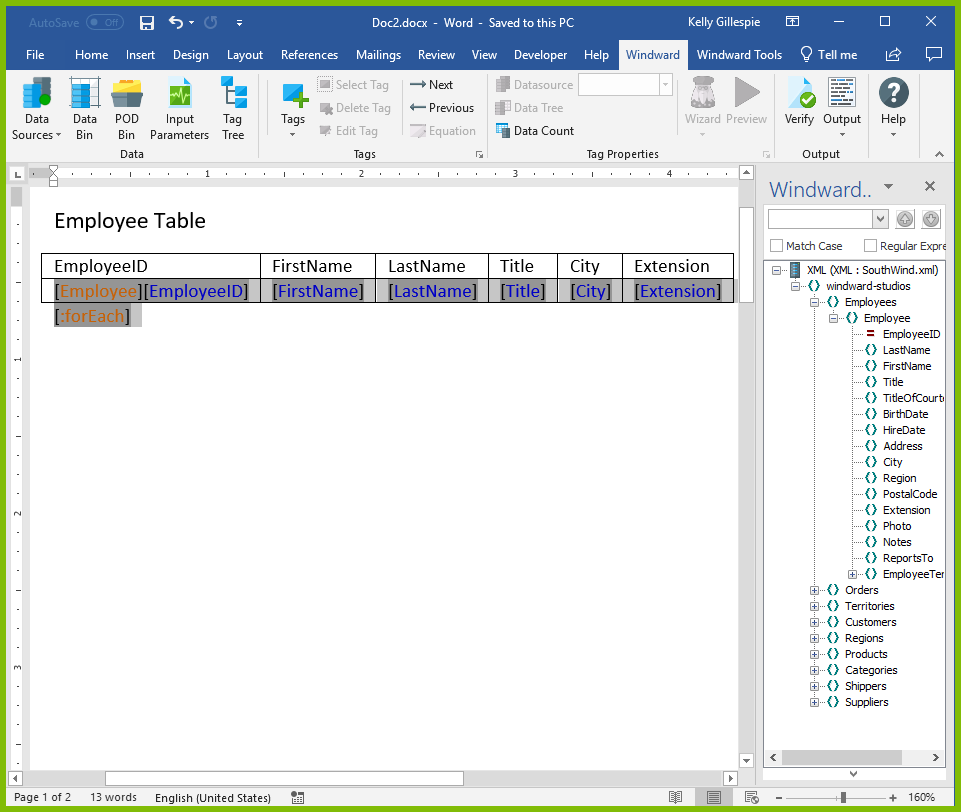
In your template, a table will appear containing headings and Tagged cells for everything that you selected:
The column titles reflect the data that will be displayed in the columns when we run the report.
-
Items surrounded by brackets ([ ]) indicate Tags. (Note: this is the default appearance of Tags. You can change this by using a nickname).
When you run the report, the software knows to present actual text as text but to treat the Tags as placeholders for data.
The Tag appears because you dragged a data group onto the template, indicating that when generated, the report should run through each listing in that group.
The Tags occur when data subgroups are inserted into a report. The Report Designer knows that each time this tag is called upon, it should display the associated value in the data source.
Generating the Output
Save the document and select the format for your report, e.g. PDF.
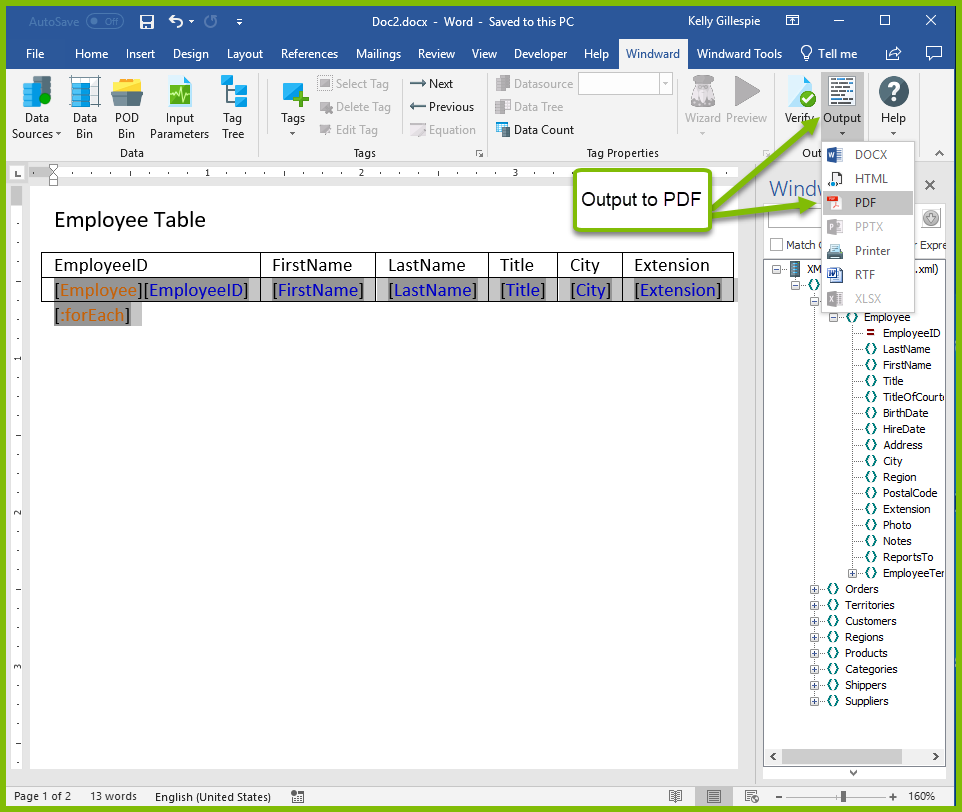
The Report Designer will then generate a PDF document like the one below, a full list of all the employee ID, First Name, Last Name, Job Title, City, and Extension that exist in the data source.

0 Comments
Add your comment