Template Debugger Reference
This is a template debugger that can help you determine why your template is not generating the output you expect. It works by stepping through the template Tag by Tag as each Tag is processed in the template. You can also set breakpoints and run the template to that breakpoint.
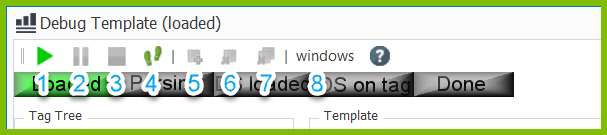
Debugger Modes
The debugger moves through a set of modes as it processes the template:
- The template is loaded. Nothing has occurred yet.
- The template is parsed. This is when the Tags are found in the template.
- The data source is initialized and loaded.
- The template Tags are processed by the data source.
- The report is complete.
Modes 2 and 4 can be stepped through Tag by Tag.
Modes 2, 3 and 4 will repeat each time an Import Tag is processed and the import is a template.
In mode 4 you can set breakpoints on Tags and then run to that breakpoint.
When an Import Tag is importing a template, that template is inserted into the main template in memory. So an Import Tag will then have to parse the template, insert the parsed template into the main template, and then start processing Tags in the imported template, as the imported template is now the next item in the main template.
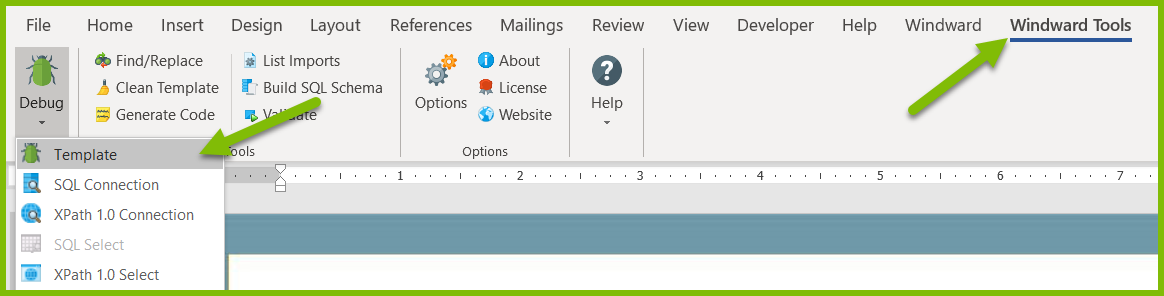
Opening the Debugger
To open the Template Debugger, on the Windward Tools tab of the Office ribbon, click on the Debugger button and select "Template."
The Menu
The Template Debugger is controlled with the buttons across the top of its interface:
- Play/Continue - run until the next mode or until a breakpoint is hit, whichever comes first.
- Pause - stop executing on the next Tag.
- Stop - stop processing the template.
- Step - run to the next Tag or mode change.
- Add breakpoint - set a breakpoint on the selected Tag.
- Delete breakpoint - delete the breakpoint on the selected Tag.
- Delete all breakpoints - delete all breakpoints.
- Windows - select the window clicked on.
The Windows
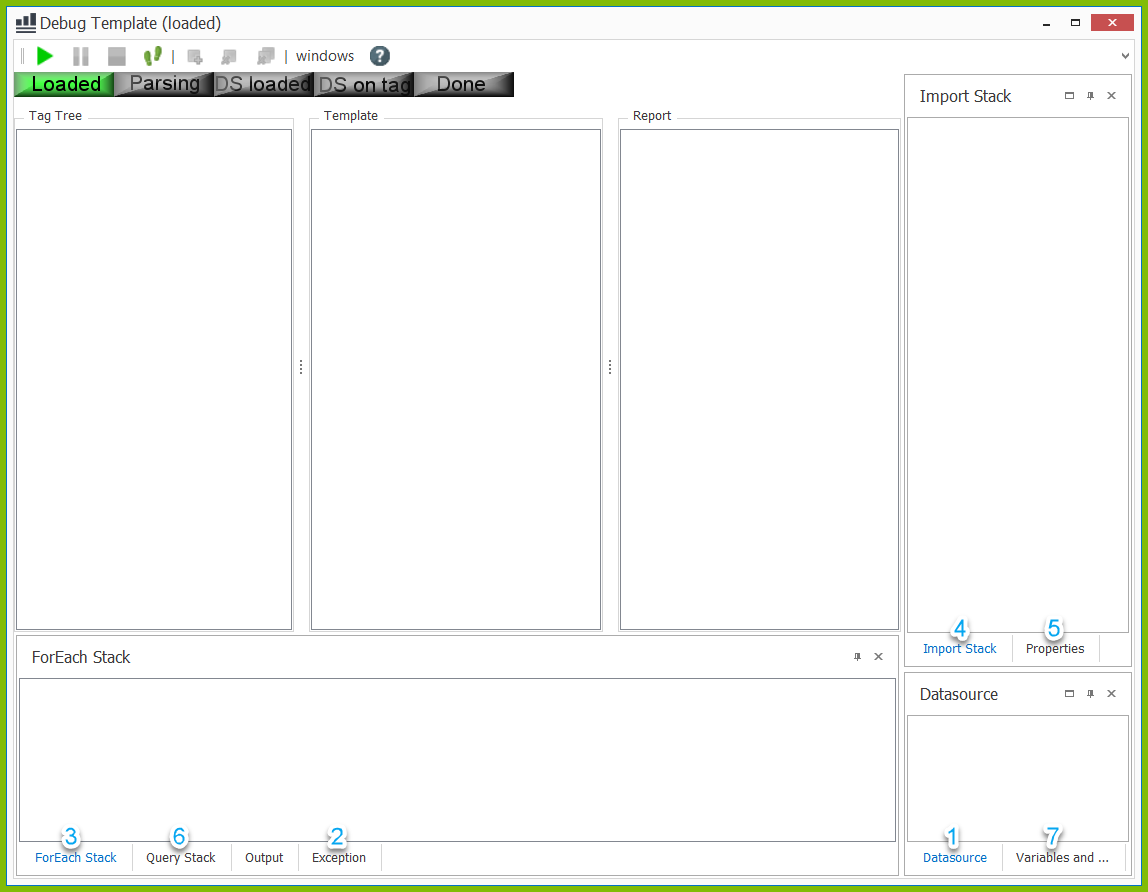
The Three Main Windows
The Debugger UI always displays three main windows. Some windows will be blank when they have nothing to display in that mode.
- Tag Tree - the Tags in the template so far.
- Template - the template as it is parsed. When Import Tags are processed this will grow to include the imported template.
- Report - the generated report. As each Tag is processed, this will grow.
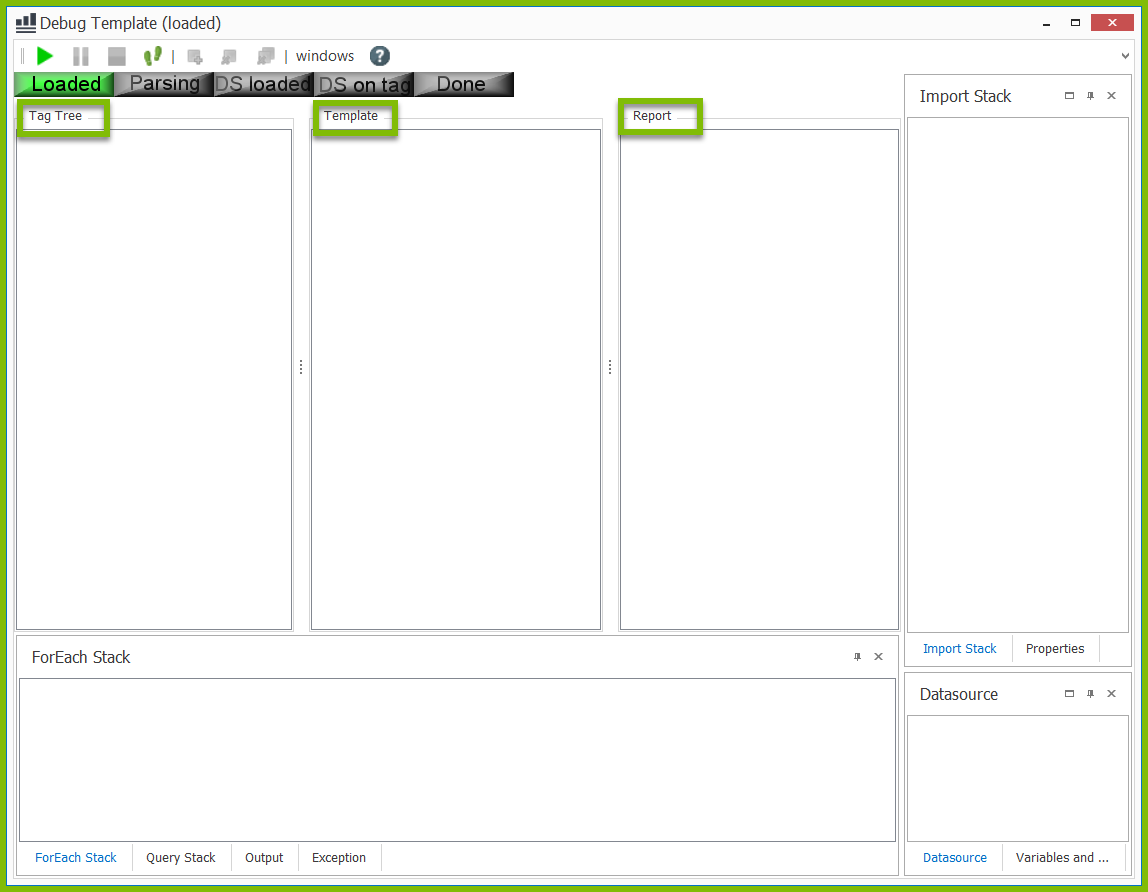
Property Windows
There are also three Property Windows, whose display depends on the tabs selected:
- Datasource - the properties of the data source presently being processed.
- Exception - if you hit an exception, this will display the exception properties.
- ForEach Stack - if you are presently inside a/several ForEach loop(s), this will list the ForEach Tags.
- Import Stack - if you are presently inside a/several Import Tag(s), this will list the imported file(s).
- Properties - when you are on a Tag this will list all of the Tag's properties.
- Query Stack - this will list all Query Tags processed already.
- Variables and Sets - this will list all variables and Set Tag values processed.
0 Comments
Add your comment