How Do I Use the XPath Select Debugger?
This article describes how to use the XPath 1.0 Select Debugger.
The debugger is very easy to use; it will show you the results of a successful XPath 1.0 query, and also the exception stack for a bad XPath 1.0 query.
XPath Debugger Interface
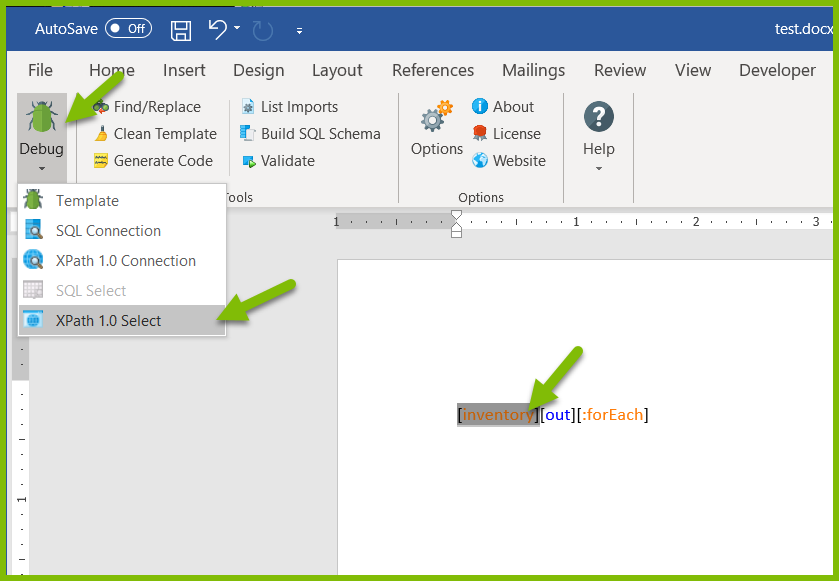
To open the XPath Debugger dialog, select a Tag with an XPath 1.0 query, and click on the "Debug" button on the Windward Tools tab of the Office ribbon:
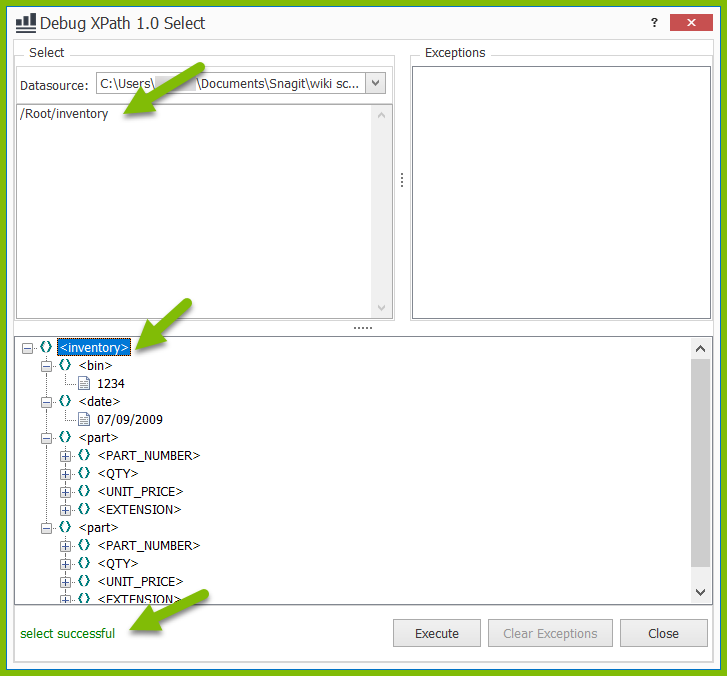
Successful Query
In the upper left-hand Select Pane, chose the data source (it must already be connected), and enter your query. If the query is successful, you will see its results in the bottom Results Pane:
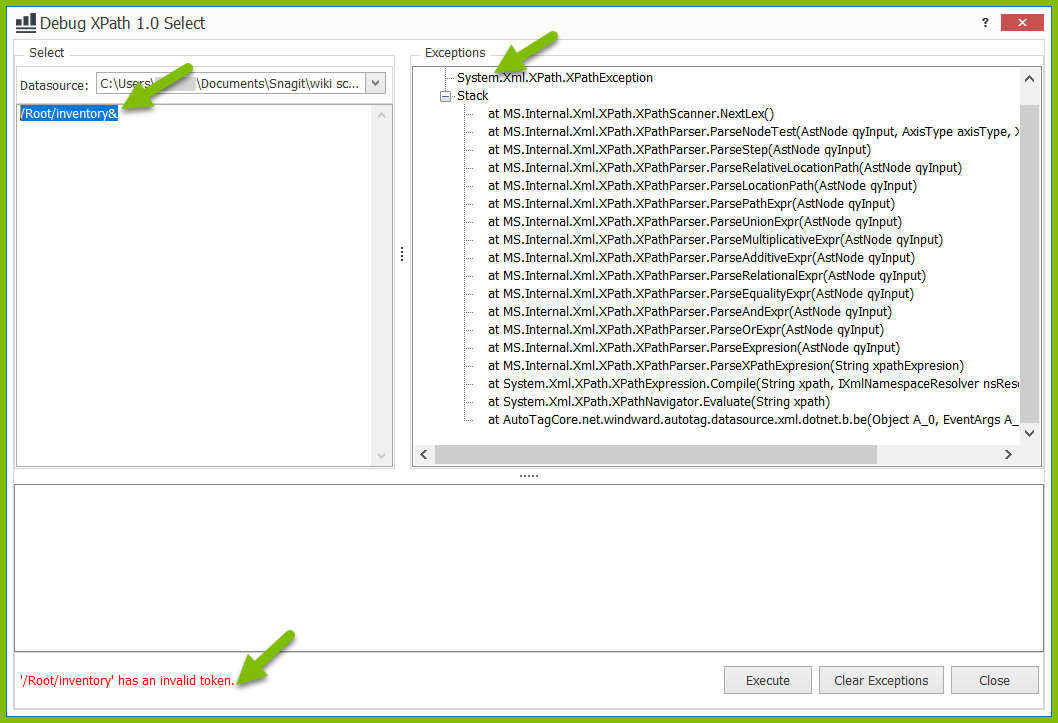
Problem Query
If the query fails with an exception, you will see the exception stack trace in the Exception Pane:
0 Comments
Add your comment